How to Monitor HVAC Filters with a Differential Pressure Transmitter
Views: 0 Author: Site Editor Publish Time: 2026-08-25 Origin: Site
To monitor HVAC filters with a DP transmitter, connect the high-pressure port to a pressure tap upstream of the filter and the low-pressure port to a tap downstream. The transmitter continuously calculates the difference between those two air pressures. As dust accumulates, filter resistance—and usually differential pressure—rises. That signal can be displayed locally, trended in a building automation system, or used to generate maintenance alarms. Reliable monitoring, however, requires more than installing two tubes. The transmitter range must suit the filter, the pressure taps must avoid turbulent locations, the clean-filter baseline must be recorded at a defined airflow, and alarm limits must reflect the filter manufacturer’s final resistance and the AHU’s operating conditions.

Key Takeaways
Connect the high port upstream and the low port downstream of the filter.
Select the DP range from the clean-filter pressure drop, permitted final resistance, and design airflow—not from a universal HVAC value.
Record the clean-filter baseline with a new filter, stable airflow, normal damper position, and a known fan speed.
Filter pressure drop changes with airflow as well as dust loading. Variable-speed systems need airflow- or fan-speed-aware alarm logic.
Low-range resolution, zero stability, repeatability, and long-term drift are usually more important than process-grade 0.075% accuracy.
Verify transmitter scaling, BAS input type, warning limit, replacement limit, alarm delay, and reset behavior during commissioning.
Why Differential Pressure Reveals HVAC Filter Condition
An HVAC filter resists airflow. The upstream static pressure is higher than the downstream static pressure because part of the fan’s pressure is consumed in moving air through the filter media. A differential pressure transmitter measures that loss directly:
ΔP = P-upstream − P-downstream
If the upstream tap measures 420 Pa and the downstream tap measures 260 Pa, the filter differential pressure is 160 Pa. In a return duct where both pressures are negative, the same logic still applies. For example, −100 Pa upstream and −250 Pa downstream produce a positive filter drop of 150 Pa:
ΔP = (−100 Pa) − (−250 Pa) = 150 Pa
As particles become trapped in the filter, the open flow area decreases and resistance normally rises. Continuous HVAC filter pressure monitoring therefore provides a condition-based maintenance signal instead of relying only on calendar replacement intervals.
Differential pressure is not determined by dust loading alone. Airflow, fan speed, damper position, filter face velocity, humidity, and system operating mode can change the reading. A clean filter at high airflow may show more pressure drop than a loaded filter at reduced airflow. This is why a single measurement without fan or airflow context can be misleading, particularly in variable air volume systems.
The strongest monitoring strategy combines filter DP with a defined operating condition. A constant-volume AHU can often use a fixed alarm based on design airflow. A variable-speed AHU may need the BAS to evaluate DP only above a minimum fan speed, compare the reading at a repeatable operating point, or use several baseline and alarm values for different airflow bands.
How to Monitor HVAC Filters with a DP Transmitter: System Components
A complete monitoring loop includes the air path, pneumatic connections, transmitter, wiring, and control logic. Each part can introduce error if it is installed incorrectly.
System layout: Air flows past the upstream pressure tap, through the filter, and past the downstream pressure tap. Tubing carries the two static-pressure signals to the transmitter. The transmitter converts the pressure difference into an analog or digital signal for the BAS or local controller.
Component | Function | Installation Priority |
|---|---|---|
Airflow direction | Defines which side is upstream and downstream | Mark direction before connecting tubing |
Upstream pressure tap | Measures pressure before the filter | Connect to the transmitter’s H port |
HVAC filter | Creates the monitored resistance | Record type, size, stage, and final resistance |
Downstream pressure tap | Measures pressure after the filter | Connect to the transmitter’s L port |
High/low pressure tubing | Transfers static pressure to the sensor | Prevent leaks, kinks, blockage, and condensate |
Differential pressure transmitter | Calculates P-high minus P-low | Select suitable medium, range, output, and zero stability |
BAS or controller | Displays, trends, alarms, and documents DP | Match input type, scaling, alarm logic, and units |
An air filter differential pressure sensor does not need continuous airflow through its tubes. It needs representative static pressure at each tap. Pressure-tap geometry and location should limit dust entry while avoiding a restriction that delays response or becomes blocked.
How to Select the Right HVAC Filter Differential Pressure Transmitter
Start with the filter and AHU data, then match the transmitter. An HVAC filter differential pressure transmitter with an unnecessarily broad range may appear safer, but it reduces the useful signal change available between a clean filter and its replacement point.
Measurement Medium
For HPM310 and HPM311, the specified medium is dry, clean, non-corrosive gas; they cannot measure liquids. This matches many ventilation pressure applications, but the pressure tubing should not be allowed to collect condensate, cleaning solution, oil mist, or water droplets. A heavily contaminated exhaust stream may require a different sensing arrangement or additional protection.
The upstream tap is on the dusty side of the filter. Position the tap and tubing so dust does not flow continuously toward the transmitter, and include inspection of the tap in the maintenance procedure. A blocked upstream tap can create a false low reading that looks like a clean filter.
Pressure Range
Choose the range from three values:
The clean filter’s initial pressure drop at design airflow
The filter manufacturer’s permitted final resistance at the relevant airflow
The highest differential pressure expected during normal and credible abnormal operation
The upper range value should exceed the intended alarm or replacement point with reasonable margin, but it should not be many times larger without a clear need. For example, a 0–100 kPa transmitter is technically within range at 300 Pa, yet it uses only 0.3% of its span and is poorly matched to that measurement.
Do not copy a range from another AHU merely because the filter dimensions look similar. Filter class, media, face area, airflow, number of stages, coil arrangement, and fan control can all change the operating DP.
Accuracy and Resolution
Filter monitoring normally needs reliable discrimination between a clean baseline, a developing restriction, and a replacement limit. Low-range resolution, zero stability, repeatability, and long-term drift therefore matter more than a very low headline accuracy percentage designed for industrial flow or closed-tank level measurement.
A dirty filter pressure sensor should provide enough signal change across the useful filter range for the controller to trend gradual loading. Accuracy must also be considered together with BAS input accuracy and zero shift from mounting position or temperature.
Output Signal
Select the output that the BAS or controller can accept:
Signal | Advantages | Selection Considerations |
4–20 mA | Live zero, good performance over longer wiring, common industrial/BAS input | Confirm loop supply, input resistance, and two-/three-wire arrangement |
0–10 V | Simple integration with many building controllers | Check common grounding, cable length, electrical noise, and input impedance |
RS485 | Digital communication and multi-device networking | Confirm protocol, register map, baud rate, address, parity, termination, and network topology |
For distributed AHUs with long cable routes, 4–20 mA is often practical. Voltage output can be convenient in a local control panel. RS485 can reduce analog input requirements, but it adds communication configuration and troubleshooting responsibilities.
Local Display and Field Configuration
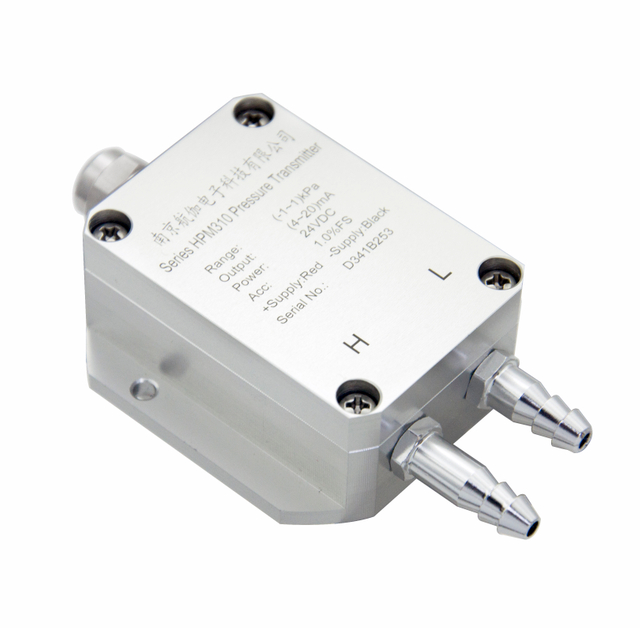
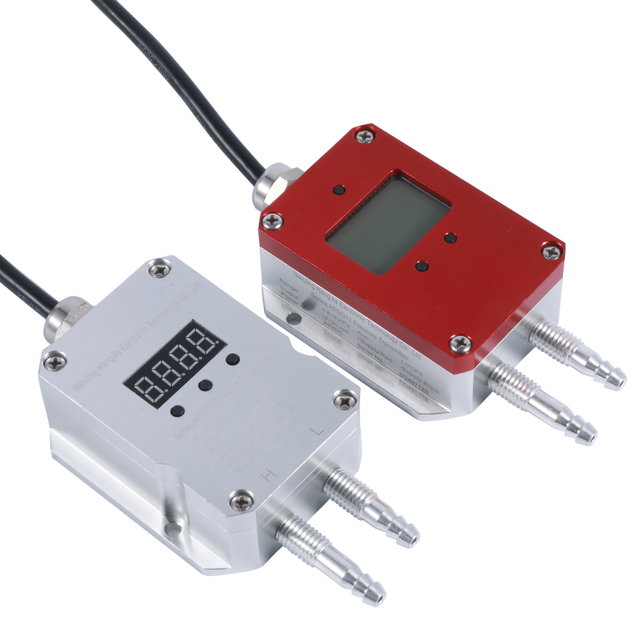
HPM310 offers 4–20 mA, voltage, or RS485 outputs and a manual zero function. Its compact housing and Ø8 mm barbed pressure connections suit straightforward duct and ventilation measurement.
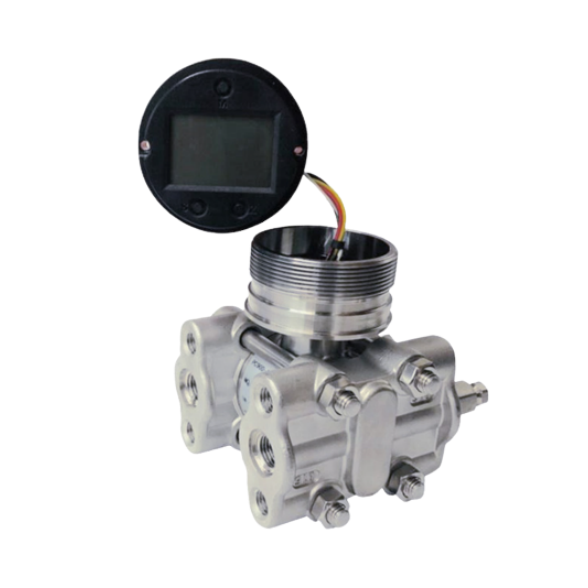
HPM311 offers 4–20 mA or voltage output, plus an LED or LCD display, field range setting, and pressure-value reset. A local display is useful when technicians need to compare the BAS value with the transmitter during commissioning or maintenance. Field configuration is valuable on projects with several filter banks, provided every range change is also updated in the BAS scaling and commissioning record.
Where to Install the Pressure Taps
Good pressure taps measure representative static pressure without being dominated by local air velocity or turbulence. The two taps should isolate the filter pressure loss rather than including unrelated pressure drops from coils, dampers, or other components.
Upstream High-Pressure Tap
Install the upstream tap before the filter and connect it to the H port. The tap should be far enough from the filter face and nearby disturbances to represent the pressure entering the filter bank. Avoid locations where dirt can directly impact and block the opening.
“High pressure” means the higher of the two measured pressures; it does not necessarily mean positive pressure relative to the room. In a negative return-air section, the upstream side may simply be less negative than the downstream side.
Downstream Low-Pressure Tap
Install the downstream tap after the filter and connect it to the L port. Place it before the next component if the goal is to isolate filter resistance. A tap placed after a cooling coil, sound attenuator, or damper would cause the transmitter to measure the combined loss of multiple components.
For multi-stage filter banks, decide whether the project needs total pressure drop across all stages or separate condition data for each stage. The tap locations must match that decision.
Avoiding Turbulence Near Fans, Dampers, and Bends
Fans, elbows, dampers, transitions, and abrupt duct changes create non-uniform pressure fields. A tap placed in a high-velocity jet or recirculation zone may produce a noisy or biased reading. Use straight, stable duct sections where practical and follow the AHU or duct designer’s tap-location guidance.
If the reading fluctuates, do not immediately add heavy electronic damping. First check tap position, loose tubes, fan instability, and damper movement. Excessive damping may hide real changes and slow alarm response without correcting the source of noise.
How to Connect the Pressure Tubing
Correct tubing is central to differential pressure transmitter installation. A precise sensor cannot compensate for reversed, leaking, blocked, or water-filled pressure lines.
Connect the upstream tap to H and the downstream tap to L. Reversed tubes normally produce a negative reading on a unidirectional filter application.
Use tubing with the correct internal diameter for the transmitter fittings. The HPM310 uses Ø8 mm barbed nozzles.
Push tubing fully onto each fitting and support it so vibration or maintenance work cannot pull it loose.
Avoid tight bends, kinks, crushing, and contact with sharp sheet-metal edges.
Keep the high- and low-side tube lengths as similar and as short as practical to support comparable response.
Route tubing to prevent low points where condensation can collect. Do not allow liquid to reach a transmitter specified only for dry gas.
Label both tubes at the taps and transmitter.
Mount the transmitter where technicians can access the zero function, display, terminals, and tubing without disturbing other equipment.
Before zeroing, remove the process differential by equalizing the ports according to the transmitter procedure. Disconnecting both tubes and exposing both ports to the same stable pressure is one common method when permitted. Never apply suction or pressure by mouth; moisture and uncontrolled pressure can contaminate or overrange a low-pressure sensor.
How to Wire the Transmitter to a BAS
Use the transmitter wiring diagram and the BAS input-card instructions. Confirm supply voltage, polarity, signal type, shield grounding, input resistance, and whether the analog input shares a common reference with other devices.
For a linear 4–20 mA transmitter, convert loop current to differential pressure with:
DP = LRV + [(I − 4 mA) / 16 mA] × (URV − LRV)
Where:
DP is the calculated differential pressure
I is the measured loop current
LRV is the lower range value
URV is the upper range value
For a 0–500 Pa range, the ideal relationship is:
Loop Current | Range Percentage | Calculated DP |
4 mA | 0% | 0 Pa |
8 mA | 25% | 125 Pa |
12 mA | 50% | 250 Pa |
16 mA | 75% | 375 Pa |
20 mA | 100% | 500 Pa |
At 14.4 mA:
DP = 0 + [(14.4 − 4) / 16] × 500 = 325 Pa
For reliable filter pressure drop monitoring, the transmitter range and BAS scaling must match exactly. If the transmitter is changed from 0–500 Pa to 0–1,000 Pa but the BAS remains scaled to 0–500 Pa, the displayed pressure will be half the correct value.
A BAS point should include engineering units, range, input type, normal status, alarm limits, delay, hysteresis or reset conditions, and sensor-fault behavior. Values below the normal 4 mA range should be interpreted according to the transmitter and controller documentation rather than automatically treated as valid negative pressure.
Establishing a Clean-Filter Baseline
The clean-filter baseline is the reference for later HVAC filter pressure drop trends. Record it only after the pneumatic and electrical installation has been checked.
Use the following conditions:
A new, correctly installed filter of the specified type and size
Design airflow or another clearly documented reference airflow
Normal damper positions
Stable fan and system operation
The same fan speed used for future comparisons
Dry, representative operating conditions
Confirmed transmitter zero and BAS scaling
Record the filter identification, installation date, DP reading, airflow or fan-speed reference, damper state, transmitter range, and test conditions. If the AHU operates at several repeatable speeds, record a clean baseline at each important operating point. These baselines allow maintenance staff to distinguish filter loading from an expected speed-related change.
A baseline is also useful after filter replacement. If the new reading remains much higher than the original clean value at the same airflow, investigate incorrect filter installation, a different filter model, blocked coils, closed dampers, tap blockage, or tubing problems before accepting the result.
How to Set Warning and Alarm Thresholds
There is no single normal pressure drop or alarm value for every HVAC filter. Thresholds should come from the filter and system design, not from a copied number.
Review:
Filter manufacturer’s initial and final resistance at the relevant airflow
AHU design documentation
Fan capability and available static pressure
Measured clean-filter baseline
Actual airflow or repeatable fan-speed condition
Building operating requirements
Consequences of reduced airflow, increased energy use, or loss of pressure control
A two-level strategy is often more useful than one alarm:
Warning level: Indicates that loading is progressing and maintenance should inspect or schedule replacement.
Replacement level: Indicates that the project-defined final resistance or operational limit has been reached.
The warning is not necessarily a fixed percentage of the replacement limit. Set it early enough to match maintenance lead time without creating repeated nuisance alarms. Add a suitable time delay and reset differential so fan starts, damper movements, or brief gusts do not trigger a persistent BAS filter alarm.
Variable-speed fans need additional logic. A loaded filter may not reach a fixed high-DP alarm while the fan is operating at reduced airflow. The BAS can qualify the alarm by fan speed or airflow, evaluate DP at a repeatable operating point, or use different thresholds across defined speed bands. Trend data should be reviewed together with fan command and airflow whenever available.
Step-by-Step Commissioning Procedure
Use the following sequence for a new AHU filter monitoring point:
Confirm range and output. Verify model, DP span, engineering unit, output, supply, accuracy, and BAS input.
Install pressure taps. Confirm airflow direction and locate taps immediately across the intended filter stage without including unrelated components.
Connect H/L tubing. Upstream goes to H; downstream goes to L. Inspect for leaks, kinks, blockage, and water traps.
Complete electrical wiring. Check polarity, shielding, input type, loop resistance, grounding, and communication settings where applicable.
Zero the transmitter. Equalize both pressure ports under stable conditions and perform the approved zero procedure.
Start the fan. Bring the AHU to the defined baseline airflow, fan speed, and damper positions.
Record clean-filter DP. Confirm the reading is positive, stable, and plausible for the installed filter.
Verify BAS scaling. Compare local display, loop current or digital value, and BAS display at one or more test points.
Configure warning and alarm. Apply project-specific limits, time delays, reset logic, fan-status qualification, and operator messages.
Document results. Record as-left range, zero, baseline, alarm settings, filter data, fan condition, test equipment, date, and technician.
Test the alarm path rather than only entering a setpoint. Use a safe simulation method approved for the project to confirm that the BAS receives the expected value, applies the delay, displays the correct message, and resets or latches as intended.
Common Problems and Troubleshooting
Symptom | Likely Causes | Checks and Corrective Actions |
Negative reading | H/L tubes reversed; airflow direction misunderstood | Trace both tubes, confirm upstream pressure is connected to H, and check sign convention |
Reading remains at zero | Fan off; equal pressures; disconnected, leaking, or blocked tubes; wrong BAS scaling | Confirm fan status, inspect taps and tubes, compare local output with BAS value |
Reading fluctuates | Turbulent taps, fan instability, damper movement, loose tubing, electrical noise | Inspect tap location and tubing before increasing damping; check signal wiring |
DP does not rise with filter loading | Tap blockage, air bypass around filter, changing airflow, wrong tap positions | Inspect filter seals, taps, airflow trend, and tube connections |
Reading changes significantly with fan speed | Normal airflow dependency; no speed compensation | Compare readings at the same speed or add airflow/speed-aware alarm logic |
Condensation appears in tubing | Poor tube routing, cold surfaces, humid air, unsuitable tap location | Drain safely, reroute to remove traps, and prevent liquid from reaching the sensor |
BAS value differs from local display | Range mismatch, wrong units, incorrect analog scaling, input-card error, wiring resistance or communication mapping | Compare configured LRV/URV, output signal, loop current, BAS scaling, and register map |
Sudden changes can provide useful diagnostics. A sharp DP increase may indicate rapid loading, wet filter media, or an airflow change. A sharp drop can indicate a torn or missing filter, bypass leakage, disconnected tube, failed fan, or blocked pressure tap. A clogged HVAC filter detection strategy should therefore use trends and operating context, not only a single high limit.
HPM310 vs HPM311 for Filter Monitoring
Nanjing Hangjia Electronic Technology Co., Ltd. (HIGHJOIN) provides both models for dry, clean, non-corrosive gas measurement. Neither model is intended to measure liquid, so tubing and tap installation must prevent condensate from reaching the sensing path.
Selection Point | HPM310 | HPM311 |
Display | No local display listed | LED or LCD display |
Output | 4–20 mA, voltage, or RS485 | 4–20 mA or voltage |
Configuration | Manual zero function | Field range setting and pressure-value reset |
Installation | Compact design with Ø8 mm barbed pressure nozzles | Sealed aluminum-alloy housing with local display and field access |
Suitable project | Compact duct monitoring, distributed analog points, or RS485 networks | AHUs where local reading and field configuration support maintenance |
Main advantage | Output flexibility and compact installation | Local visibility and commissioning convenience |
HPM310 ranges are listed from 0–100 Pa through 0–100 kPa, with bidirectional ranges available. HPM311 ranges are listed from 0–200 Pa through 0–100 kPa, including negative or bidirectional configurations. Accuracy varies with working range on both families, so confirm the ordered span and specification rather than selecting from the family maximum.
Choose HPM310 when RS485, compact mounting, or its output flexibility is the priority. Choose HPM311 when technicians benefit from a local display and field configuration. In either case, the most important decision is selecting a range that makes the clean-to-loaded filter change clearly visible.
Conclusion
Effective filter monitoring begins with a simple pneumatic arrangement: upstream pressure to H, downstream pressure to L, and a correctly ranged transmitter measuring the difference. The system becomes reliable only when pressure taps, tubing, wiring, BAS scaling, baseline data, and alarm logic are treated as one measurement loop.
Record clean-filter DP at a defined airflow and fan speed. Set warning and replacement limits from the filter’s published resistance, AHU design, fan capability, and building requirements. For variable-speed systems, qualify the alarm with airflow or fan-speed information so reduced airflow does not hide a loaded filter. HPM310 suits compact, multi-output installations, while HPM311 adds local display and field configuration for maintenance-oriented AHU projects.
FAQs
What is a normal pressure drop across an HVAC filter?
There is no universal normal value. Initial and final pressure drop depend on the filter type, dimensions, efficiency, face velocity, airflow, and system design. Use the filter manufacturer’s data at the relevant airflow and confirm the clean baseline after installation.
Where should the high and low pressure ports be installed?
Connect the high port to a static-pressure tap immediately upstream of the filter and the low port to a tap immediately downstream. Place both taps away from fans, dampers, bends, high-velocity jets, and other components whose pressure loss should not be included.
How do you select the correct transmitter range?
Start with the clean-filter initial drop and the allowed final resistance at design airflow. Select a span that covers the replacement limit and credible operating excursions with reasonable margin while keeping the useful clean-to-loaded change large enough for stable trending.
When should the dirty-filter alarm be triggered?
Trigger it at the project-defined limit based on filter final resistance, AHU design, fan capability, airflow, and operating requirements. A warning plus a higher replacement alarm usually supports better maintenance planning than one generic fixed threshold.
Why does filter differential pressure change with fan speed?
Higher fan speed usually increases airflow and pressure drop through the filter. Lower speed reduces both. Filter loading and airflow therefore affect DP together, which is why comparisons and alarms should use a consistent operating point or fan-speed-aware logic.
Can one transmitter monitor multiple filter stages?
One transmitter can measure the total pressure drop across a complete multi-stage bank by placing its taps before the first stage and after the last. It cannot identify which stage is loaded. Separate tap pairs and transmitters, or a suitable multi-channel arrangement, are needed for individual stage condition monitoring.